DISPLAYS / DATA LOGGER / IOT FOR MONITORING
Installing multiple measurement instruments to monitor and optimize compressed air systems require powerful data loggers on site. Additionally, it is important for compressed air users to visualize the measurement data on site, like flow, water consumption, pressure, temperature, humidity or any other relevant parameter. Logging all kind of meters is helping operators to get their system under control.
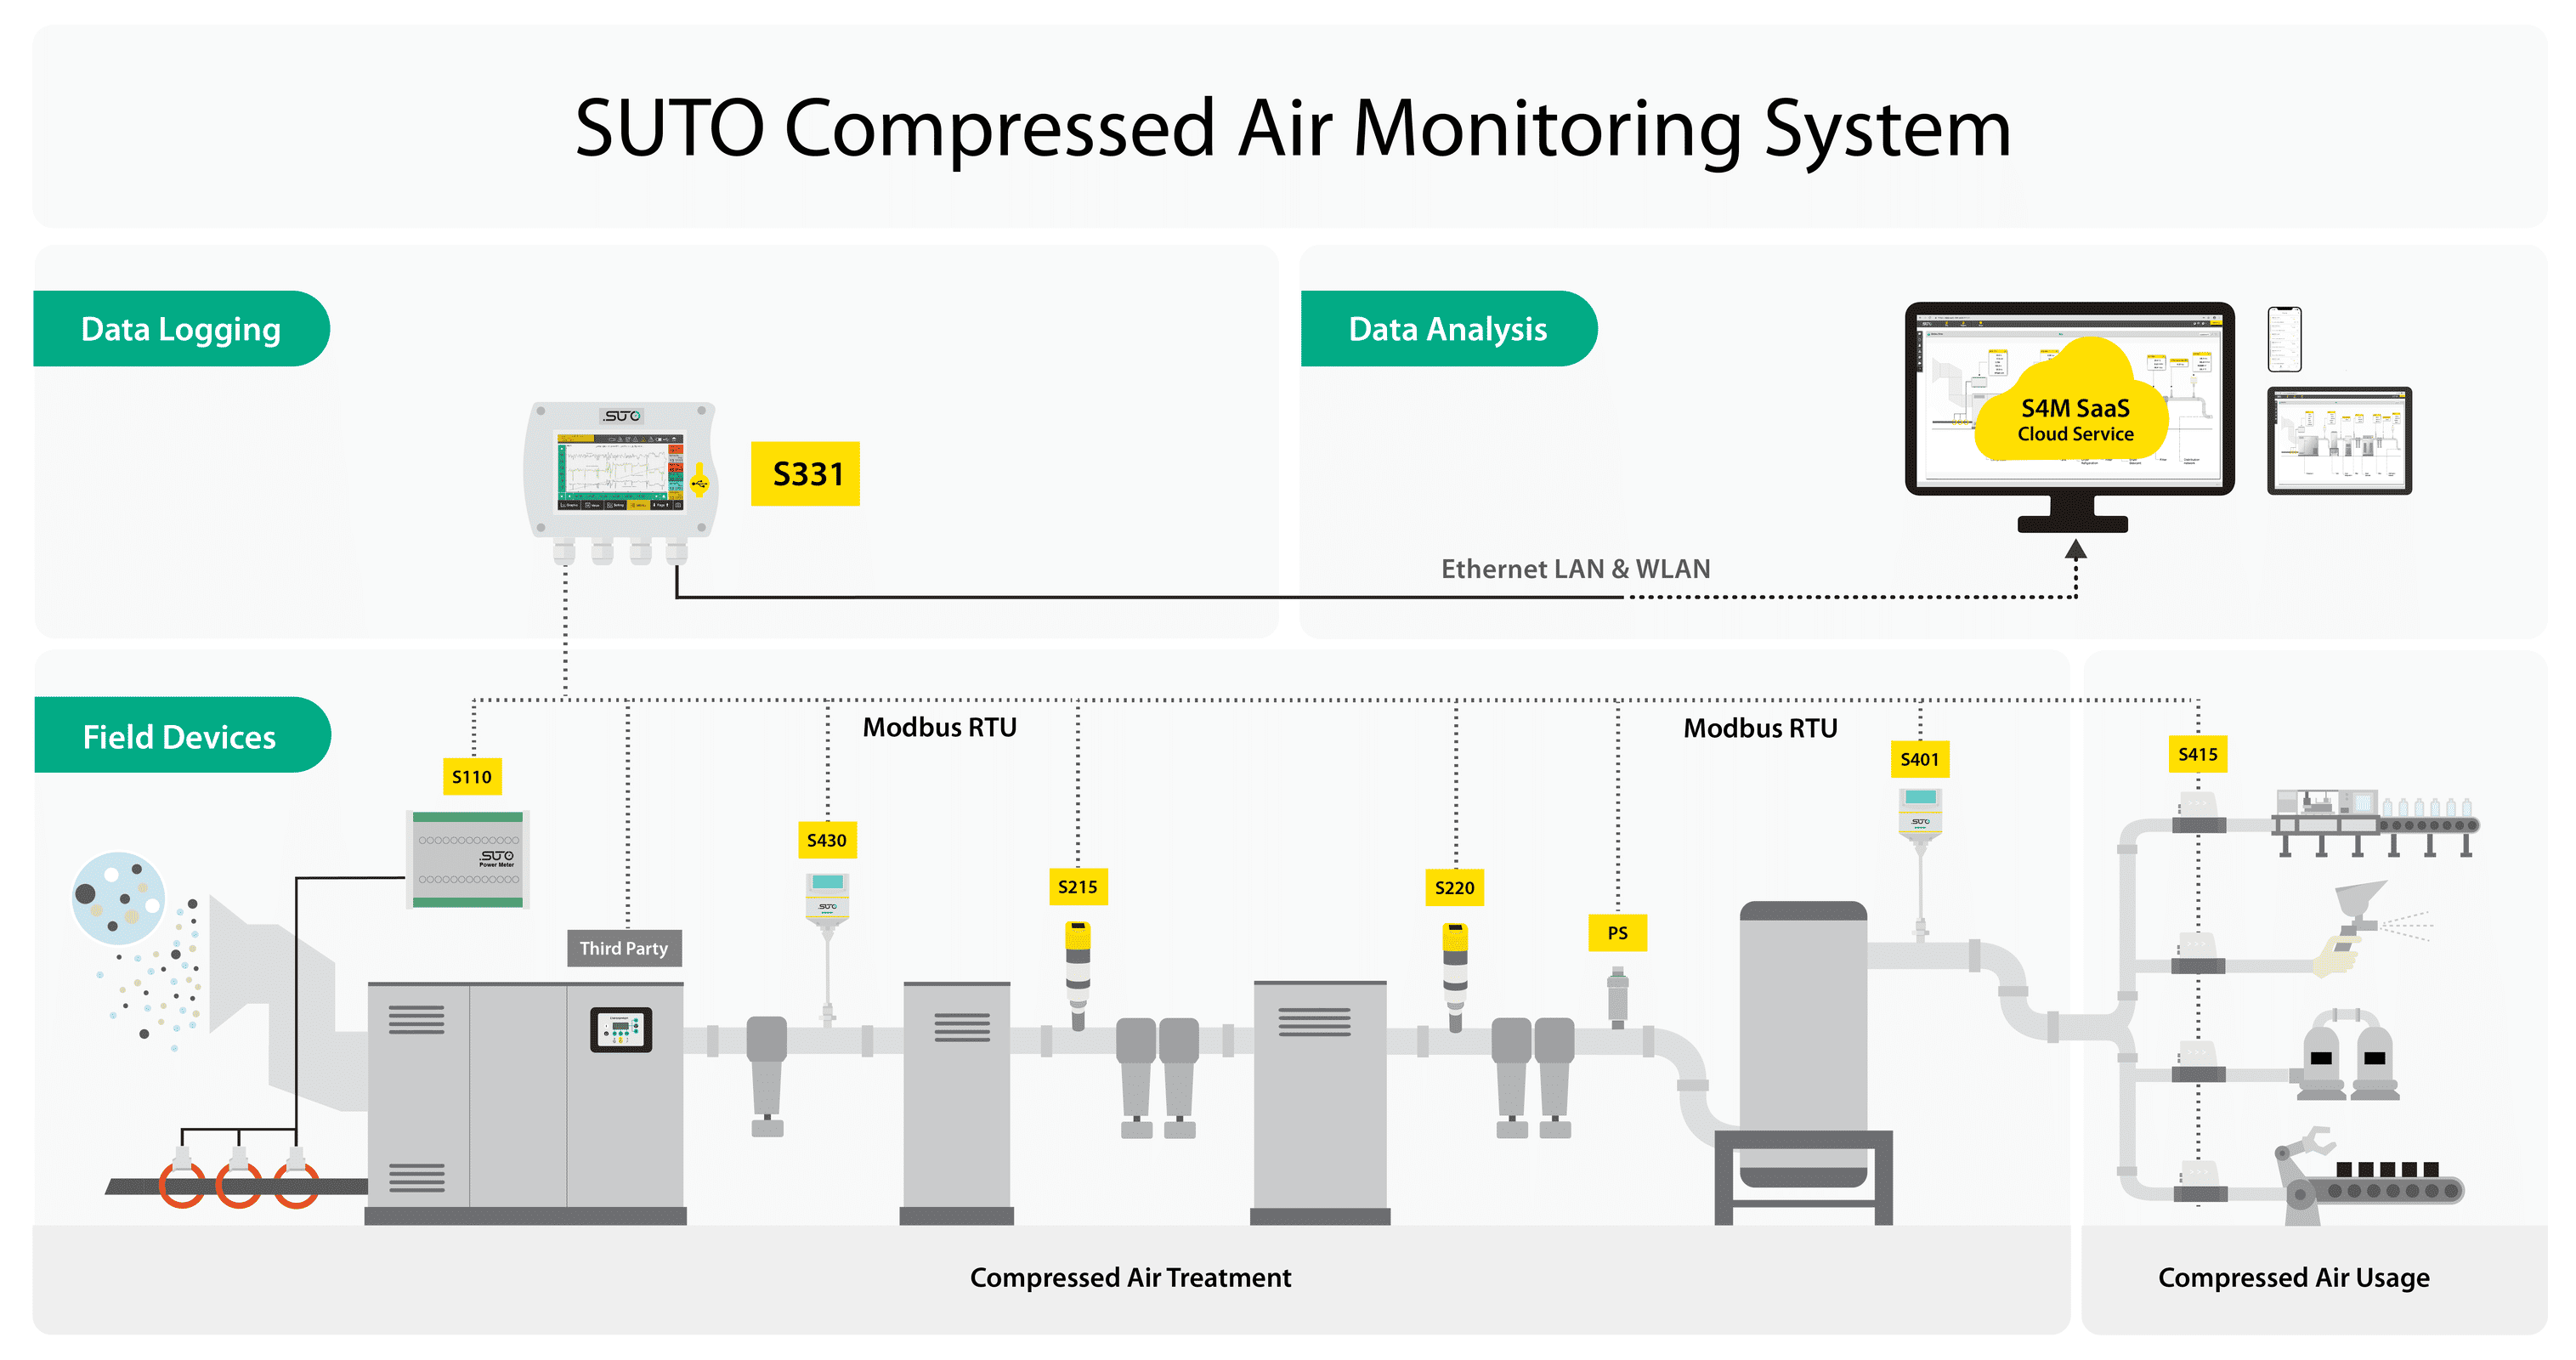
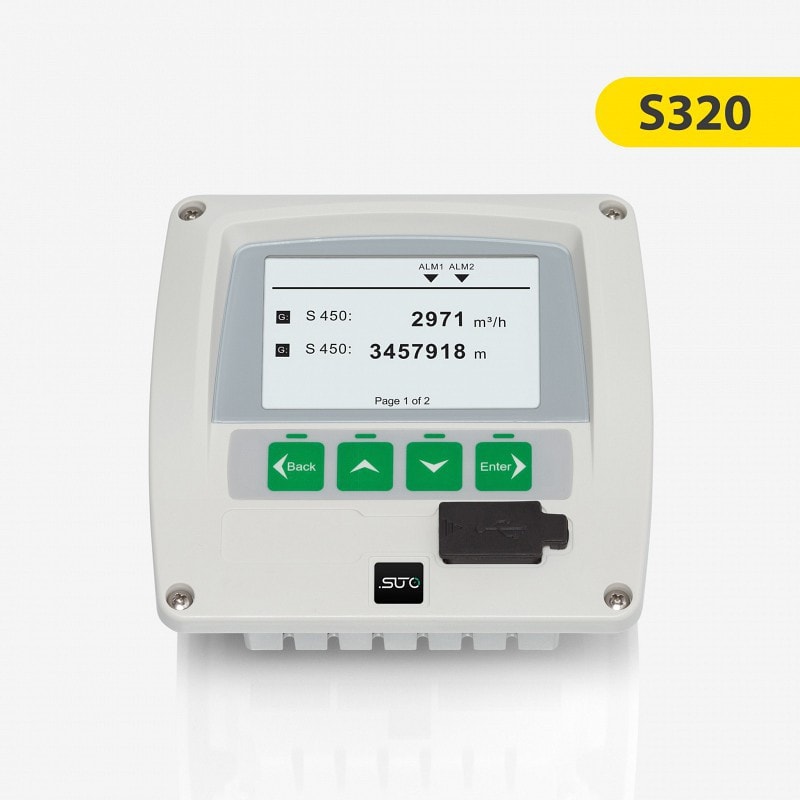
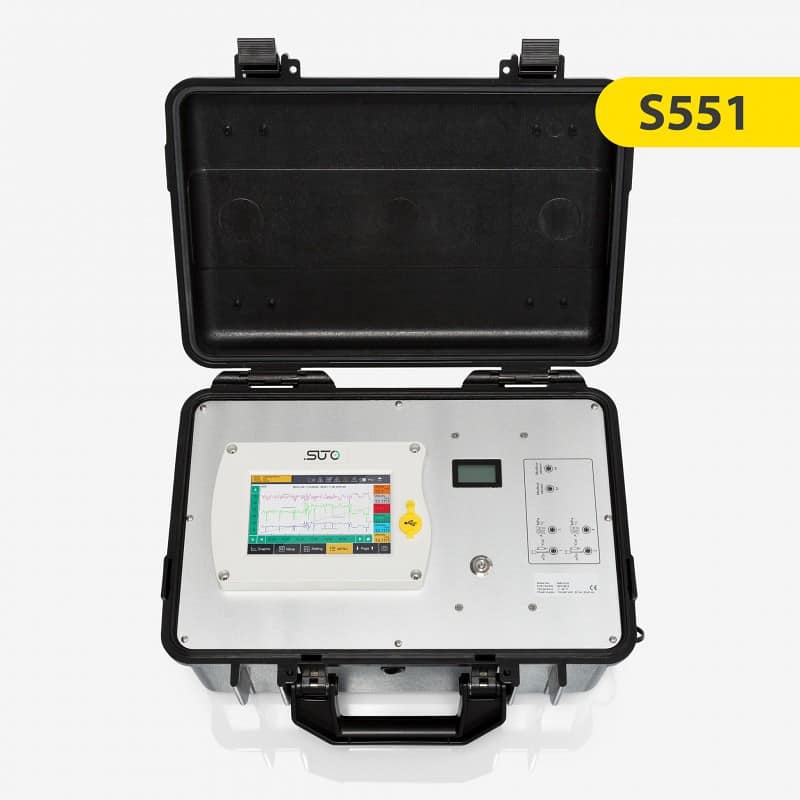
SUTO Display and data loggers are the central units of data collection in a monitoring system, providing real time values, alarm morning and seamless integration into SCADA systems. Furthermore, the data loggers are used as gateways, bringing the analog measurement signals into the digital world.
IMPORTANCE OF DATA LOGGER AND DISPLAYS
SUTO Displays and Data loggers provide standardizes Modbus/RTU and Analog sensor inputs, but also offer data interfaces like Modbus/RTU and Modbus/TCP to send the data to application software. Besides that, integrated IoT interfaces enable the data loggers to be connected directly to cloud-based monitoring solutions using standard protocols, making them ready for Industry 4.0.
In the following, we have summarized all relevant information and questions about data loggers and displays for compressed air measurement devices.
Logging the measurement data can easily help to identify problems in compressed air system
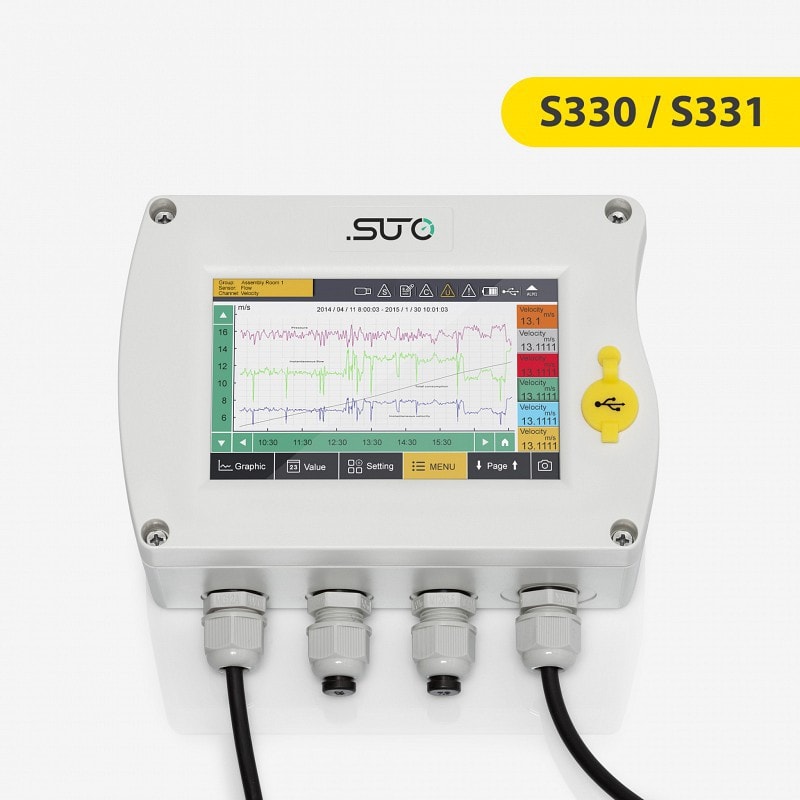
SUTO display and data logger are flexible, providing users an easy-to-use operation and offer various signal in and outputs. The big touch screen display allows users to visualize measurement data on site as well as programming alarms and perform quick graphic analyzes.
Displays and data logger are the central system of a monitoring solution, acting as a data logger with huge storage capacity, but also being the interface between the measurement meters and software solutions for reporting, analyzes and monitoring.
What is the purpose of a data logger when measuring in compressed air systems?
Furthermore, the displays are the perfect tool to visualize the measurement data on site, making it easy for operators to track and understand their compressed air system. But also compressed air quality according to ISO 8573 must be logged. Measurement data of all meters, like residual oil, temperature, humidity, pressure, particle concentration and dew point, must be safely recorded and stored for audit reports.
How are the Displays and Data loggers operated on site?
The Graph view is so powerful, that users have the possibility to have short analyzes on site already, so there is no need to download the data. Alarms for any channel can be easily programmed by a simple touch, communication settings and parameters can be accessed and changed through the menu.
SUTO displays and data loggers are designed to be user-friendly and easy to set up, almost any configuration can be done on site via the touch screen interface.
What types of sensors can be connected to the displays and data loggers?
But not only SUTO’s own products are supported, third-party sensors can be integrated as well. For this, standardized signal inputs as Modbus/RTU and 4..20 mA Analog are integrated. This makes it easy to connect any meter or device to the data loggers. And even if the third-party protocol is not Modbus/RTU or an analog signal, there are gateways ready available which allow users to connect even other data protocols.
Please contact our service team if you want to connect third-party devices which are not using Modbus/RTU.
How much data can be saved on a SUTO data logger?
But since the logged files are typically read out by the user at least once a year, typically every 3 months, the data logger is likely to never get full at any point.
Are SUTO products ready for IoT and Industry 4.0?
Thanks to the integrated MQTT IoT standard, SUTO products are easy to be connected to cloud based solutions, like monitoring software or other SCADA software solutions. The sensor data is available in real-time, so users know what’s happening in the system at any point of time.
How are SUTO displays and data loggers set up?
The software is installed on a PC and connects to the loggers using a USB interface or by utilizing the local network. The configuration software guides users through a simple menu to set up sensor connections, location and measuring point management, as well as alarm, logger and communication settings. The configuration can then be downloaded to the device and additional saved to a local file.

Personal advice
Would you like to receive more information about products and applications?
Or do you need personal advice? We will be happy to help you!


